

FY 2025–26 didn’t just underperform — it punished. Every major Indian equity benchmark closed the year in the red. Nifty 50 fell 8.23%. Nifty 500 fell 6.82%. Maximum drawdowns hit 14–15% across the board. Sharpe ratios went negative. Sortino ratios went negative. For allocators running passive equity, there was nowhere to hide.
This wasn’t a one-quarter blip. It was a full twelve months of sustained foreign selling, rupee depreciation, global capital rotation into U.S. tech, and a domestic market that refused to reward patience alone.
Clearmind’s mandates were built for exactly this kind of year.
Polaris — our discretionary PMS — delivered +0.63% absolute return. Positive. In a year the Nifty 50 lost 8.23%. That’s +8.86% of relative alpha with a positive Sortino of 0.25, while every benchmark posted negative risk-adjusted returns.
Optimus — our algorithmic volatility engine — delivered +45.88%. Sharpe of 1.04. Sortino of 1.14. Fifty-four percentage points of outperformance over the Nifty 50.
Different strategies. Different mandates. Same discipline. Both did what they were designed to do.
What happened to the market.
The macro picture was hostile from start to finish.
Foreign portfolio investors pulled a record $18.4 billion from Indian equities in calendar 2025 — the largest annual outflow ever recorded. March 2026 alone saw ₹1.14 lakh crore exit in a single month, with FPIs selling on every single trading session. The rupee breached ₹90/$ in December 2025. U.S. 10-year yields stayed elevated, making risk-free dollar assets more attractive than emerging-market equity. The AI and semiconductor boom channelled global capital into the U.S., South Korea, and Taiwan — away from India. U.S. reciprocal tariffs on Indian exports added a layer of policy uncertainty that no model could fully price.
The result: broad Indian equities delivered negative returns, negative Sharpe, negative Sortino, and drawdowns deep enough to test every long-only allocation.
For context:
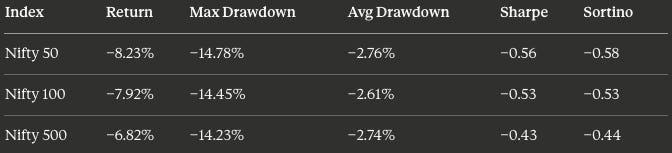
Every row is red. Every risk metric is negative. This is what a year of uncompensated equity risk looks like.
Polaris: Capital preservation when it counted.
+0.63% return · −17.75% max drawdown · 0.12 Sharpe · 0.25 Sortino
Polaris is a discretionary PMS mandate. It doesn’t chase momentum. It doesn’t promise outperformance every quarter. It promises a process: conviction-weighted positions, active risk management, and the discipline to cut exposure when the market isn’t paying you to hold it.
FY 2025–26 was the year that process proved itself.
A positive absolute return — even a modest one — in a year where every headline index lost money is not a small thing. It means capital was preserved. It means the drawdown-recovery cycle starts from near the surface, not from a 8–15% hole. It means compounding resumes immediately.
The numbers in context:
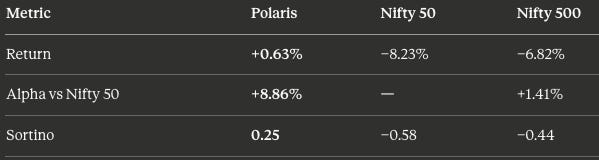
Polaris posted positive Sortino in a year the benchmarks posted negative. That single line tells the story: downside was managed better than passive exposure, and the strategy didn’t need a bull market to function.
Was the max drawdown painless? No. At −17.75%, it was material. But it sat within the range of a difficult equity year, and the average drawdown of −4.06% confirms that stress was episodic, not structural. The strategy spent most of the year near the waterline — which is exactly where you want a core allocation to be when markets are bleeding.
The takeaway: Polaris is not just designed for years like 2020–21, where everything goes up and beta is the only edge you need. It’s designed for years like 2025–26, where staying afloat is the edge. This was a capital-preservation year, and the mandate delivered.
Optimus: Asymmetry, delivered.
+45.88% return · −26.13% max drawdown · 1.04 Sharpe · 1.14 Sortino
Optimus is an algorithmic options-buying strategy. It is not a core equity allocation. It is not designed for consistency. It is designed to harvest volatility when regimes shift — and to endure the flat or painful intervals between those shifts without breaking.
FY 2025–26 gave it exactly the conditions it was built for: repeated risk-off episodes, elevated implied volatility, and sharp directional moves that rewarded convexity.
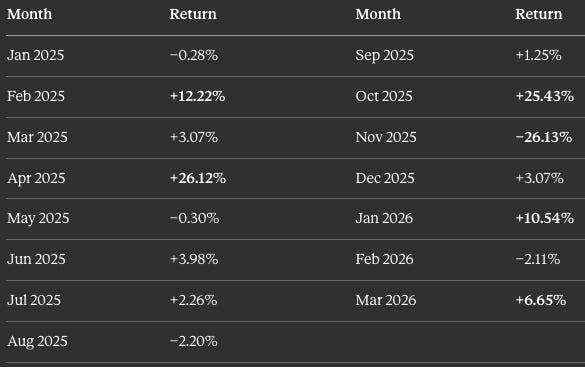
The monthly returns tell the real story:
Three things stand out.
First, concentration. April (+26.12%) and October (+25.43%) together account for the majority of the year’s return. This is not a flaw — it is the defining characteristic of long-volatility strategies. Regime shifts are rare. When they arrive, the strategy capitalises. The rest of the time, it waits.
Second, the drawdown. November 2025 was a −26.13% month — the maximum peak-to-trough episode for the year. That is real pain. It is also the cost of carrying convexity. Investors who cannot absorb a month like November should not be in this strategy. But investors who can absorbed it saw the strategy recover +10.54% in January 2026 and +6.65% in March 2026 — the asymmetry working exactly as intended.
Third, the compound outcome. Despite the drawdown, despite the flat months, the strategy compounded to +45.88% with a Sharpe above 1 and a Sortino above 1. In a year where the Nifty 50’s Sharpe was −0.56. The gap between these two numbers — 1.04 versus −0.56 — is one of the widest risk-adjusted spreads a strategy can produce against its benchmark.
The takeaway: Optimus returned +45.88% in a year the market lost 8.23%. But more importantly, it did so with a risk-adjusted profile that justifies the volatility it demands. This is not a strategy for every investor. It is a strategy for investors who understand that asymmetry requires patience, sizing discipline, and emotional tolerance for drawdowns.
Two mandates. One framework.
Polaris and Optimus are not interchangeable. They are complementary.
Polaris is the anchor. Core allocation. Multi-cycle compounding. Designed to stay afloat in down years and compound meaningfully in up years. The benchmark to beat is not the Nifty — it’s the cost of doing nothing. In FY 2025–26, doing nothing (passive index) cost you 7–8%. Polaris cost you nothing. It preserved.
Optimus is the edge. Tactical allocation. Volatility sleeve. Designed to produce outsized returns in specific market regimes, with the understanding that it will be flat or negative in between. The benchmark to beat is not the Nifty either — it’s the opportunity cost of holding that capital in cash or low-vol assets. In FY 2025–26, Optimus turned that opportunity cost into +45.88%.
Together, they form a portfolio architecture that doesn’t depend on the market going up.
What this year proved.
FY 2025–26 was a year of reckoning for the Indian equity market. Record FPI outflows. A weakening rupee. Global capital rotating away from India. Negative returns across every major index. Negative Sharpe and Sortino everywhere.
For passive allocators, it was — in the words used by many — “all pain, no Sharpe.”
For Clearmind clients, it was something different. Not painless — drawdowns were real in both mandates. But the outcomes diverged from the benchmark experience in scale and in character.
Polaris preserved capital. Optimus generated alpha. Neither required a favourable market to function.
That is not a one-year pitch. That is the mandate.
Past performance is not indicative of future results. Investments in securities markets are subject to market risks. Returns stated are for the period indicated and may not be replicated. This report is for informational purposes only and does not constitute investment advice.
SEBI Registered Portfolio Manager: INP000009816 · Research Analyst: INH000010098
© 2026 Clearmind Consultancy Pvt. Ltd. All rights reserved.